Log in
Watch Our Video
This guide supports our Charity Excellence Data Sharing and Survey Policies by providing oversight of how the core system model works.
The core model runs on a standard SQL database but is a completely bespoke design built specifically to support the non profit sector. No organisation can run effectively without some structure, systems and procedures so the model tests these but it is not a quality management system. High performance can only be delivered by people and the sector is people driven so it leans into something called soft systems methodology to put people at the heart of what it does. It is what would be more correctly known as a decision support system (DSS) or, if you prefer, a digital mentor for charity trustees and management.
It works for any UK non profit, no matter how small and including CICs, charitable schools and UK based international charities and it requires no charity, management or IT expertise to use, is free and is quick and simple to use.
It also aggregates all user data into its Charity Sector Data Store, effectively creating Big Data for the charity sector. Launched in 2018, it now has 0.75 million data points covering every aspect of charity activity, and including data from both the Covid and Cost-of-Living crises.
The starting point draws on soft systems methodology to create an explicit definition of what a non-profit organisation aims to do and how this is achieved.
To reflect the functional structures that exist in many charities, 8 core functional areas were created with definitions for each.
Systems and processes operate across an organisation, not only vertically within core functions, which is accounted for using cross cutting categories. The core functions are divided into categories comprising results and the underpinning enabling systems. This process is also intended to assist users in identifying silo working.
|
Core Functions |
|
|
Results |
|
| Enabling Systems | Oversight & Planning |
| Management Systems | |
| Financial Management | |
| Risk Management & Compliance | |
| People Management | |
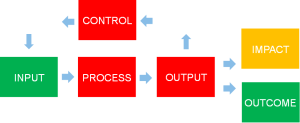
The overall model is treated as a system, using a basic cybernetic control loop. The model goes beyond this to include outcomes, defined as the positive difference this makes for beneficiaries, and impact the extent to which delivering these outcomes maximizes the overall impact in delivering the charitable mission.
These are defined as follows:
The system includes a number of specialist sub models. The score for any given model is the average of the statements included in the model. The system reporting is a rolling 6 month average to ensure there is sufficient data for the score to be robust.
The Critical Health Check Table, on the dashboard, uses search flags within the system to assess metrics that are seen as key for funders and other stakeholders, as follows:
There are also a range of other sub models, including:
To create each non profit's unique framework of questionnaires, users complete their My Profile Page set up, which takes about 2 mins. This includes data such as their legal structure, location, number of volunteers, beneficiaries etc, sectors (about 30) and the activities they undertake.
The system also has 100 data tags comprising groups of people, their engagement, what they do, when and how, and any key issue such as cost, training, application and use in decision making.
These 2 components enable sub models and data sets to be created in an almost limitless combination of ways.
Assessment statements may comprise who, what, when, how and any key issues. What is included in any given statement varies depending on what is needed. It assesses not whether something exists but where it is working well. The system holds 500+.
Each user is only given what they need and this also allows the system to include activities of relevance to only a few users. Consequently, some statements are scored very often and others only rarely.
The statements are worded in plain, simple English, so no expertise is required to rate these.
The system uses My Profile page data to allocate relevant statements based on income bands, locations, sectors etc to create a digital model of a non profit unique to its needs. However, as people are more comfortable with questionnaires and these often follow the delineation of management responsibilities, the system creates 8 questionnaires.
Each questionnaire is set up to lead the user through the process of board oversight, systems and procedures, functional activities and finally planning. It's not a training system but is intended to help people better understand how a functional area works and , to support this, each statement has links to people who can help and resources and guides.
Which questionnaires users choose to score varies from 300+ every 6 months up to 1000. The number of statements in each varies according to the needs of the user but the average is roughly 26. The most frequently scored is Income Generation, followed by Governance.
Users rate each statement on a scale of 1 to 5 and in 2 ways.
In business terms, Achievement and Importance reflect Needs and Wants.
The system tracks scoring patterns and, if these are unrealistic, will create a scoring Quality Alert on the dashboard and will not award the quality mark until questionnaires are rescored.
Users can fine tune their framework by selecting Not Applicable. For example, for building related assessments, such as capital expenditure budgeting, because they may or may not have premises and, if they do, may own or rent.
The algorithms convert the scores into ratings from 0% to 100%.
These are primarily driven by the Achievement scores but the Importance rating can modify any given statement score by plus or minus 12.5%. This optimises reporting for users by highlighting activities that are important to them and deprioritising those that aren't. However, in practice, this is believed to have little overall impact on the data sets.
Consequently, the percentage score is a measure of the priority for action a charity has. In assessing data sets, we compare scores longitudinally and with each other to identify material changes.
To make the system work well for everyone it has to be as simple as possible and nobody has either the capacity or resources to deal with everything, so the system highlights those areas of greatest opportunity to achieve more. A red indicator isn't a 'fail'. These roughly correspond to the 4 quartiles from 0% to 100%, but with adjustments to zero out some inherent over scoring.
| Category | What it means |
|---|---|
| Must Do | Significant opportunity to achieve more |
| Should Do | Opportunity to achieve more |
| Could Do | Some opportunity |
| Don’t Do | Little, if any opportunity |
Users aren't interested in all that. What they get is.
Data is reported in 2 different ways.
Master Dashboard. Firstly, via the original master dashboard created in 2018 and reports (2021). The dashboard is the same as the user dashboard but aggregates data by averaging all user scores. It allows drill down into ratings but the only additional analytical functionality is the ability set any date period in displaying data. It also reports some key metrics, such as the automated feedback systems and numbers and ratings for questionnaire scores and has 4 reports.
Microsoft Power Dashboards. In 2024, thanks to the OR Society and Sujith who volunteered, 9 interactive dashboards were created using Microsoft Power. These enable the system's data to be analysed in a huge range of ways.
A registered charity ourselves, the CEF works for any non profit, not just charities.
Plus, 100+downloadable funder lists, 40+ policies, 8 online health checks and the huge resource base.
Quick, simple and very effective.
Find Funding, Free Help & Resources - Everything Is Free.